Track Master
Powerful tools that will take you to the next level.You’ve captured your track performance data. Now use the industry leading race data analysis software to find that perfect lap.
Control
Track Master puts you in the driver’s seat. Decide for yourself which plots to put on screen, how to arrange them, and what data to see in them. Display everything you need and nothing else. That’s control.
Flexibility
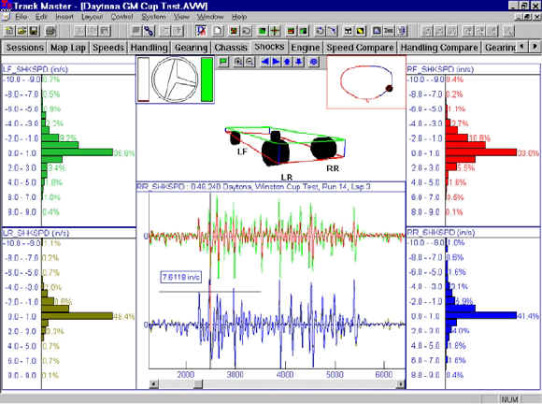
Track Master provides the flexibility to analyze data the way you choose, using X-Y plots, signal vs. signal plots, map plots, suspension animation displays, histograms, bar graphs, numeric displays, driver controls graphics, text reports, map markers and more.
Speed
We don’t like slow things. That’s why we engineered our Track Master race data analysis software to load your data with blinding speed, so your team never has to wait for us.

Extremely Graphic
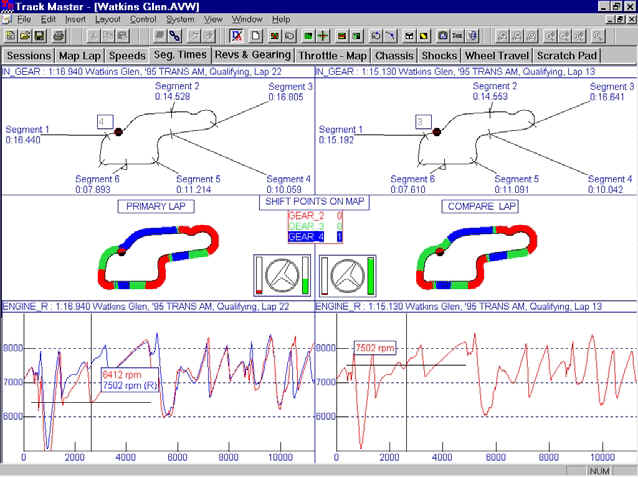
Is your data trying to tell you something? Information is only valuable when you can understand it–and do so quickly enough to make changes before your next on-track session.. Track Master helps you visualize your data so you can make the best decisions for your team. View side-by-side graph comparisons of a “decent” lap versus your qualifying lap– or your teammate’s fast lap. View all your shift and braking points directly on the track map. Annotate your graphs with the built-in text tool. With Track Master you’ll see everything clearly, and you’ll be faster the very next session.
Get Animated
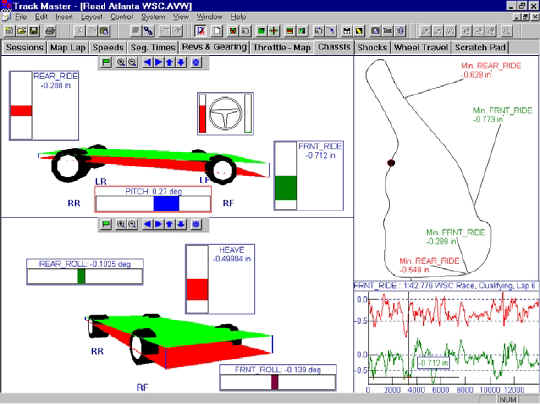
Do you really know what your car is doing? Stop staring at numbers and graphs. Use Track Master’s 3D Chassis Analysis to actually see how your car is behaving. Rotate your chassis to view it from any angle and watch it animate in real time with your sensor and track data. Understanding your data has never been this intuitive.

Report This
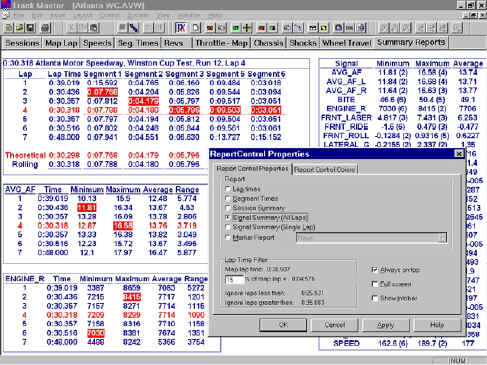
Once you’ve collected and analyzed your data, you need to be able to collate and save it for future reference. Track Master provides flexible reporting tools that let you to store a summary of your data for later use. Generate segment time reports for the entire session, including the fastest rolling lap and the fastest theoretical lap. Display Min/Max/Average values for all your sensors for the session. Create map-based reports using the improved map markers feature which let’s you to position markers wherever you want.
Want Even More?
These optional add-ons can give it to you.Pro
You’ve cut your teeth on racing data analysis, now it’s time for a bit more power. With the Pro option, customize your screens, your plots, and your layouts, to focus on the information that’s important to you.
Math Channels
TrackMaster comes pre-programmed with dozens of the most commonly used values and equations to fine-tune your performance. Most race data analysis software doesn’t offer that. But for those who want even more control, TrackMaster gives it to you. With Math Channels, you decide what values you want to see, and create the calculations you want, using your raw data, your basic constants, and your own equations.
Suspension Pack
Want to tune the car’s suspension to your specifications? With the Suspension Pack, you get years of track-side experience with a set of pre-built screens and calculations focusing on optimizing suspensions. Get it just how you want it.


