Track Master: Suspension Pack
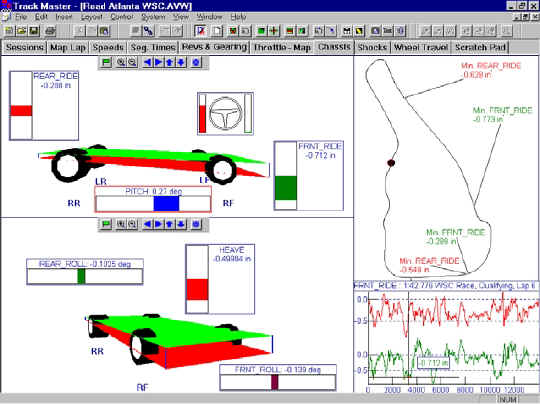
Pre-built screens and calculations focusing on optimizing suspensionsThe Chassis Animation display shows a 3-D representation of the “Chassis Plane”. This screen shows the reference plane (green) and moving plane (red) as solids. (the example on the opposite page uses the “wireframe” option. As you move the cursor around the map of the track or across a x-y plot, the chassis and all the bar graphs update or “animate“ Moving the cursor can be done manually point by point, or can be run automatically at three selectable speeds. This screen also demonstrates that you can easily have more than one chassis animation showing several views of one set of data, or even view several data sets side by side.

The prime benefit of the Chassis Animation is that it lets you watch actual action of your chassis on the track, rather than trying to visualize it yourself while looking at graphs. Of course you can also look at the graphs in Track Master if you like. The small graph in the lower right of this screen might not seem useful until you realize that any graph, no matter how small, can be instantly zoomed to full screen with 1 keystroke.
Bar graphs displaying all the common chassis parameters have been added to this screen. This illustrates that in Track Master you can “layer” displays on top of each other to create screens as you want them to appear rather than being constrained by someone else’s idea of how to show the data.
