Force & Load Sensors
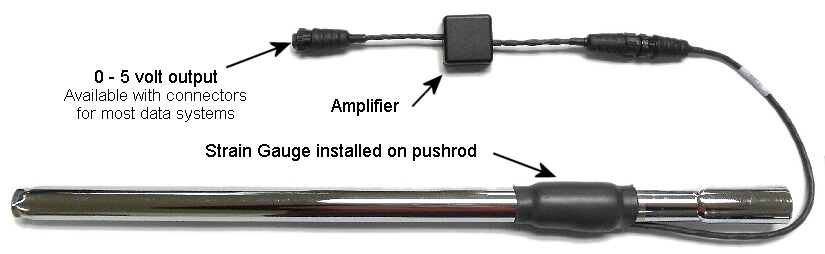
SEN-12S Strain Gauge Installation Service With Amplifiers
Usable with any racing data acquisition system
Measures:
- Dynamic Corner Weights
- Load Transfer
- Aero Loads
Strain Gauge Data Analysis
Strain gauges on the push rods (or pull rods) of a race car enable you to log dynamic corner weights. The CDS Track Master software turns this corner weight raw data into many useful answers such as:
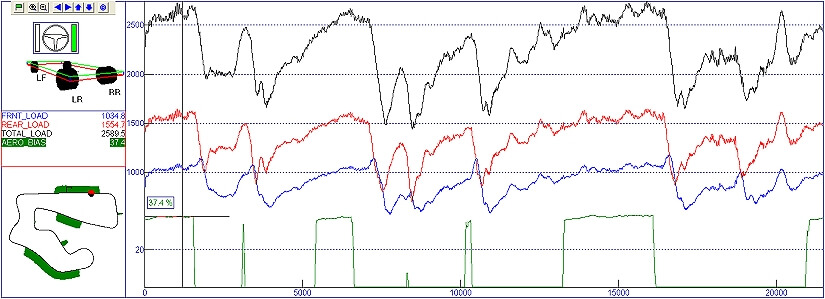
The Front Load, Rear Load, and Total Load are calculated (from the individual wheel loads) and from those signals we calculate the Load Bias and Aero Bias. The Load Bias is the percent of total load that is acting on the front of the car, which includes weight transfer due to acceleration, deceleration, and change in pitch of the road (hills). If you take those effects out you are left with just the aero loads.
Aero Bias (shown in dark green in the above plot) is the percent of total downforce that is acting on the front of the car. The Aero Bias formula has built-in conditions to ignore the times when the car is under hard acceleration, braking, or turning so that front/rear load transfer does not factor into the calculation. If your system has a vertical G sensor then you can also factor out road pitch. The map in the lower left shows the parts of the track that are used to determine the Aero Bias. Since there is always some acceleration, deceleration, and road pitch in actual track data, the Aero Bias calculation is not perfect but is close and is very good for comparing aero changes on the same car at the same track. It can also be used in coastdown testing where the results are very close to wind tunnel results.
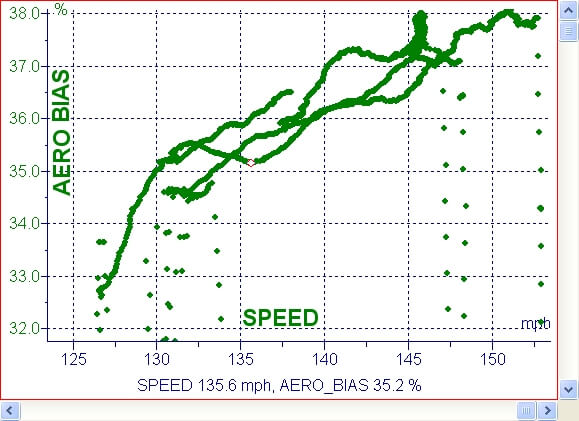
The Aero Bias data is plotted as a function of Speed to determine the change in aero balance with speed. As seen in this plot, the percent of total downforce that is acting on the front increases from about 33% at 127 MPH to about 38% at 153 MPH. Aero Bias slightly increasing as speed increases is desirable and stable.
Generally speaking it is best to limit the variation in Aero Bias with speed.
The minor deviations from a perfect curve reflect the “real world actual track data” limitations discussed above.
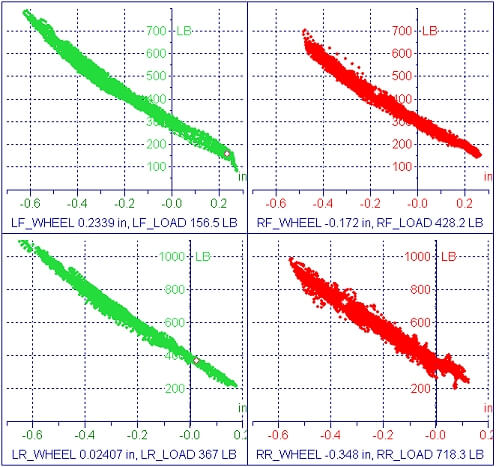
Plotting the individual loads vs. wheel movements give a picture of the effective Wheel Rates at all 4 corners. The slight curve up at higher loads shows the effect of bump rubbers or “packers” on the actual wheel rates.
These plots can also help identify mechanical problems such as excessive friction, binding or other hysterisis in the suspension. Notice the wider distribution of data points in the lower right plot (for the Right Rear). There are also numerous “outlier” data points in the Right Rear plot. These are due to a mechanical problems such as a loose joint, binding, sticking shock, etc. Zooming in on these data points and seeing where they occur can help to isolate handling issues that are being caused by mechanical problems.
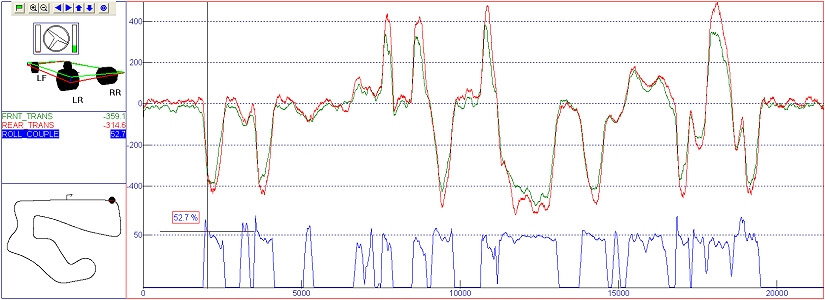
The Front & Rear Lateral Load Transfer are calculated and plotted here in green and red respectively. The Roll Couple, which is the percentage of lateral load transfer that occurs at the front of the car, is also shown (in blue at the bottom). The roll couple illustrates how the load transfer distribution changes as the car goes through the various phases of cornering. Notice the high initial values of the roll couple at the turn in point of some of the corners as compared to others. Since the higher values of Roll Couple correspond to more weight transfer occurring at the front, these points could indicate high damper forces or bump rubbers engaged at these points.
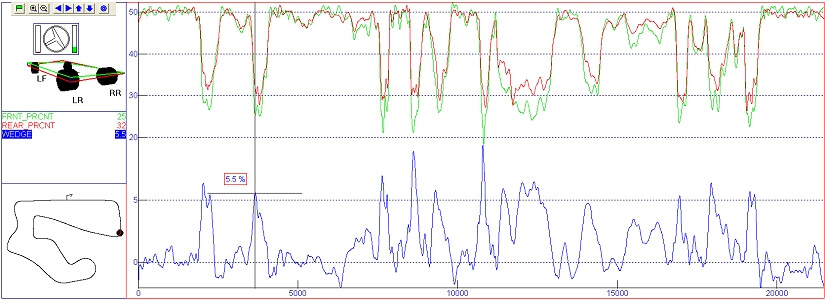
Other calculated signals that can be generated from the load data include Percent Inside Wheel Load at each end of the car. This is the percentage of total load at each end of the car that is carried by the inside wheel. In the top 1/2 of plot above, the Front Inner Percent is shown in green and the Rear is shown in red. The load on the rear is more evenly distributed in the corners
The rear inner percent minus the front inner percent is called the Dynamic Wedge (shown in blue in the above plot). Usually the greater the dynamic wedge, the more the car will tend to understeer, since the rear of the car is working better than the front (from a weight distribution perspective).
Having actual load data can be huge advantage to the Race Engineer who knows how to use and analyze it. All of the above formulas (and much more) are included in the latest release of the CDS Track Master software.